- Ripple price declined further below $0.3080 and tested the $0.3000 support area against the US dollar.
- The price traded as low as $0.2983 and it is currently correcting above the $0.3050 level.
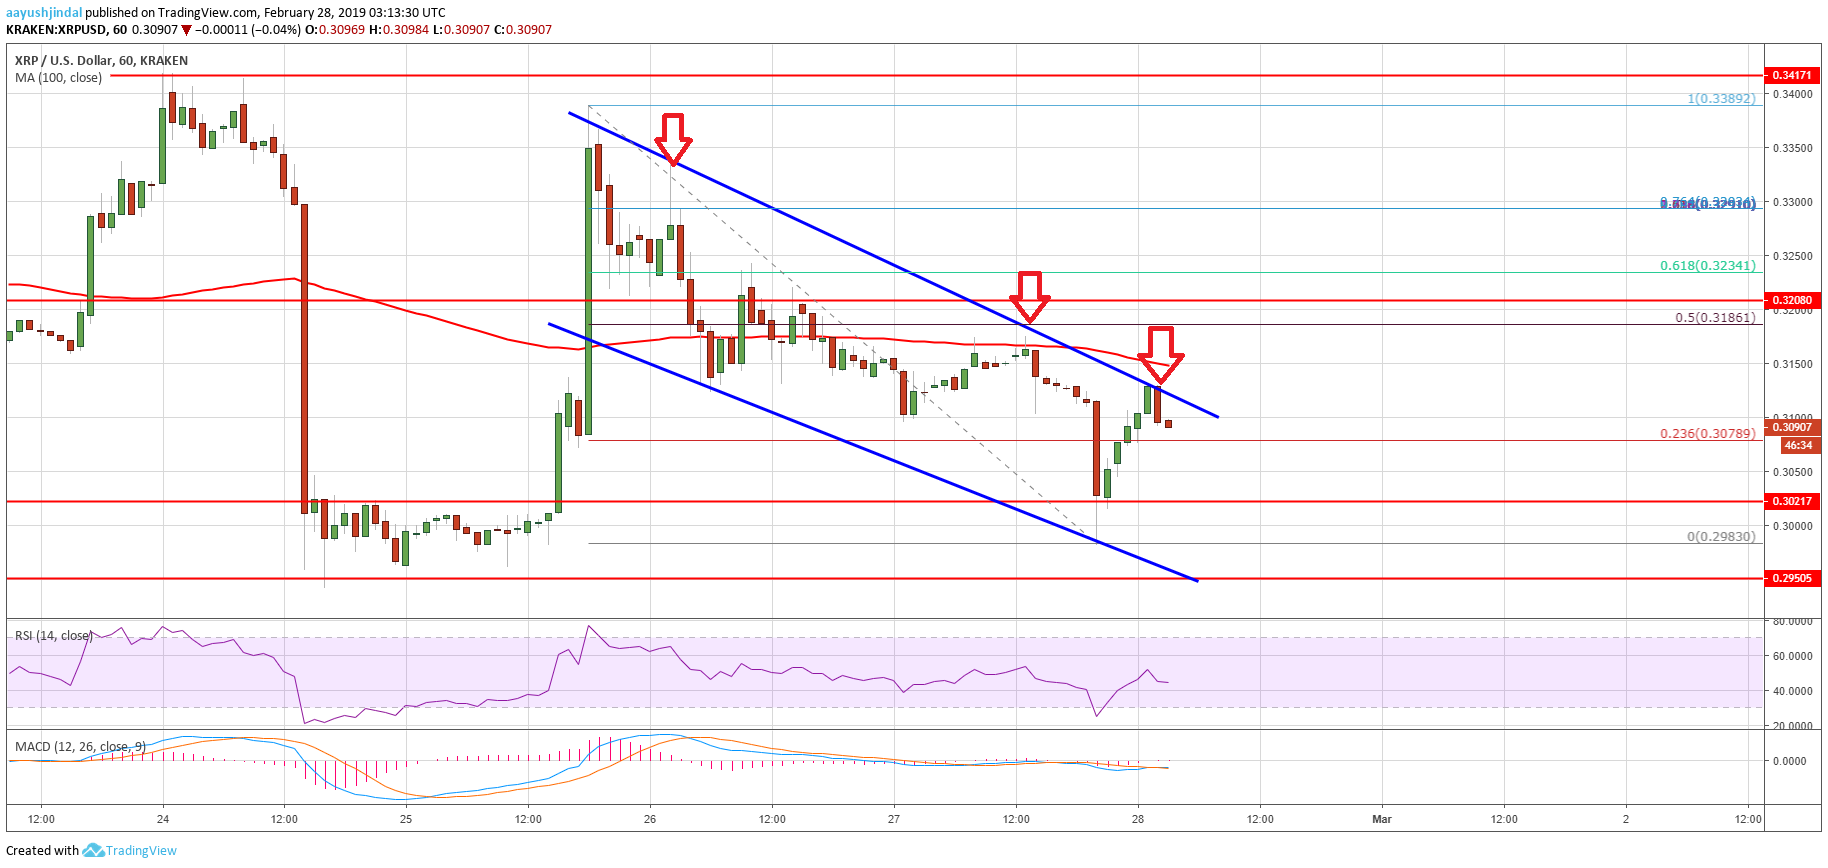
- There is a major declining channel in place with resistance near the $0.3145 level on the hourly chart of the XRP/USD pair (data source from Kraken).
- The pair is likely to face a lot of hurdles near the $0.3150, $0.3185 and $0.3200 resistance levels.
Ripple price moved back in a bearish zone against the US Dollar and bitcoin. XRP/USD declined steadily before it bounced back after testing the $0.3000 support level.
Ripple Price Analysis
Yesterday, we discussed the chances of more losses towards $0.3000 in ripple price against the US Dollar. The XRP/USD pair failed to hold gains above the $0.3200 support and later declined. It broke the $0.3145 and $0.3150 support levels to move into a bearish zone. There was a proper close below the $0.3150 level and the 100 hourly simple moving average. The price traded below the $0.3050 support and even spiked below the $0.3000 level. A new intraday low was formed at $0.2983 before the price started an upside correction.
Buyers pushed the price above $0.3050 and the 23.6% Fib retracement level of the recent drop from the $0.3389 high to $0.2983 low. However, there is a strong resistance formed near the $0.3145 and $0.3150 levels. More importantly, there is a major declining channel in place with resistance near the $0.3145 level on the hourly chart of the XRP/USD pair. Above the channel resistance, the 100 hourly SMA is positioned near the $0.3150 level. The next key resistance is near the $0.3185 level. It represents the 50% Fib retracement level of the recent drop from the $0.3389 high to $0.2983 low.
If there is an upside break above $0.3150, the price could face sellers near $0.3185 or $0.3200. On the other hand, if the price fails to move above $0.3200, there could be a fresh decline. An initial support is near the $0.3050 level, below which the price may revisit $0.3000.
Looking at the chart, ripple price seems to be trading in a bearish zone below $0.3200. As long as XRP is placed below $0.3185 and $0.3200, it remains in a downtrend. On the downside, a break below the $0.3000 support will likely push the price towards the $0.2850 level in the near term.
Technical Indicators
Hourly MACD – The MACD for XRP/USD is likely to remain flat in the bullish zone.
Hourly RSI (Relative Strength Index) – The RSI for XRP/USD failed to stay above the 50 level and moved to 45.
Major Support Levels – $0.3050, $0.3020 and $0.3000.
Major Resistance Levels – $0.3150, $0.3185 and $0.3200.
The post Ripple Price Analysis: XRP Following Downtrend Channel Below $0.3200 appeared first on NewsBTC.
from NewsBTC https://ift.tt/2NzkUnS
No comments:
Post a Comment